Performance Guide
Scene performance comes down to two things: how many pixels you ask the GPU to draw, and how much work it does for each one. Every control in this guide reduces one or the other — and most scenes can be made dramatically faster without looking any different.
Start Here
If you only do four things, do these:
- Downsample your layers. In the test page, lower the downsample on any layer without sharp edges. This is usually the single biggest win.
- Lower the resolution. Try DPI at 1 and Scale at 0.75. Most scenes look nearly identical.
- Cap the frame rate. Ambient background scenes rarely need more than 30 FPS.
- Turn on Flatten. It merges your layers into one optimized shader.
Then republish — optimization changes only reach your live embed after you publish again.
The rest of this guide walks through each lever, then the tools for measuring your scene, then a few page-level tips.
Downsampling
Every layer has a downsample control (0.25, 0.5, 0.75, or 1) in the test page's pipeline panel. It renders that layer at a fraction of its size, then scales the result back up.
The math is on your side: downsampling to 0.5 halves the width and the height, which means 75% fewer pixels to compute. Anything soft — blurs, glows, fog, gradients, smooth noise — can usually run at 0.5 or even 0.25 with no visible difference. Keep full resolution for layers with fine detail, like text and crisp shapes.
Republish your scene after changing downsampling for it to take effect in your live embed.
Resolution: Scale and DPI
Two settings control how many pixels your whole scene renders:
- Scale (0.25–1) — the rendering scale of the canvas. At 0.5, the scene renders at half size and stretches to fit. Soft, ambient scenes often look great at 0.5–0.75.
- DPI (1–2) — pixel density for high-resolution displays. 2 matches retina screens pixel-for-pixel, but it's 4x the work of 1. For most scenes, 1–1.5 is the sweet spot.
Experiment with both in the test page, or set them directly on your embed:
Start low and raise the values until you notice a difference. Scene size matters too — a small module costs far less than a fullscreen background.
Frame Rate
data-us-fps caps the render loop (24, 30, 60, or 120). Dropping from 60 to 30 halves the GPU work per second, and slow, ambient motion often looks identical at 30. Save 60+ for fast motion and mouse-driven effects.
Flatten (Beta)
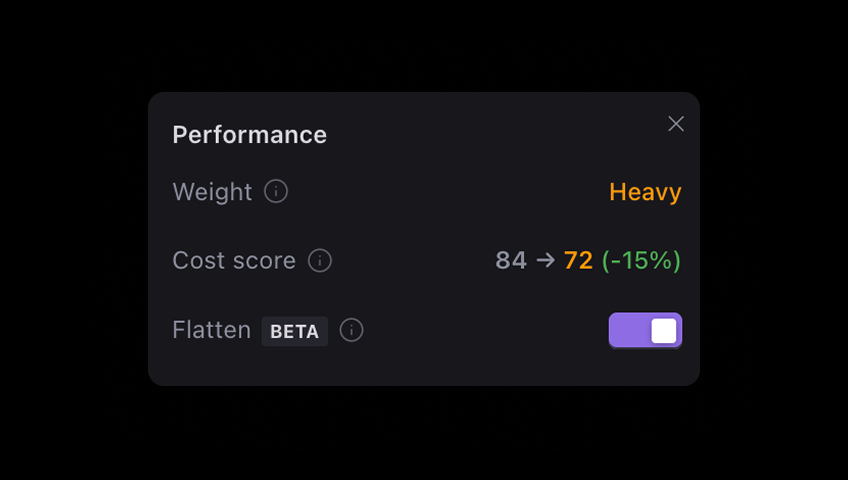
By default, every layer renders as its own shader pass, chained together with render targets. Flatten merges compatible layers into a single, intelligently optimized shader instead — reusing shared functions, culling unnecessary work, and cutting draw calls. Toggle it on when you publish and watch the cost score drop.
There's a bonus: if your scene uses a mask (a vignette, a masked shape), Flatten skips heavy effects entirely for pixels outside the visible area — you stop paying for pixels no one sees.
Most layers flatten: images, shapes, text, distortions, most single-pass effects, and most 3D models. A few can't:
- Multi-pass effects (like 90s VHS) need multiple shader passes.
- Ping-pong effects (mouse ripple, mouse trail, light draw) keep separate render targets.
These don't stop you from using Flatten, but they break the merge chain at their position in the stack. Keep them at the top of your layer stack so everything beneath them can still merge.
If a layer won't flatten
Some properties quietly require sampling the background, which a single flattened shader can't do. If a layer isn't flattening when you expect it to, check:
- Blend on projection or polar distortion — turning blend to zero can suddenly allow flattening and unlock large savings.
- Chromatic dispersion
- Certain stretch/liquify settings
- 3D models with glass materials or a background environment map
Measuring Your Scene
Performance estimator
Press F in the editor to see a cost score from 0–100 and a general estimate of how expensive your scene will be. Glance at it as you build — it's the fastest feedback loop you have.
The test page
Open the test page from the Export window for a live profiling environment. Press C or ⌘/Ctrl + . to toggle the controls. Three areas to know:
- Pipeline panel (left) — your layer stack, bottom to top, with a downsample control and the real pixel dimensions for each layer. This is where the big wins happen. Flattened layers appear as a single merged entry, and the topmost output layer follows the global Scale setting instead of its own downsample.
- Settings & preview — change Scale, DPI, and FPS in real time, and simulate dark/light page backgrounds, smaller sizes, and scrolling. When you change a setting, a toast asks if you'd like to publish the optimization.
- Render stats (right) — the headline is the Performance label (Excellent, Good, Strained, or Poor) and budget usage: under 100% means you're hitting your target frame rate. Draw calls, frame times, and texture memory are broken out below if you want the details.
What makes a layer expensive?
Some effects do heavy math for every pixel, every frame. Watch the estimator when stacking these:
Aurora, 3D Shape, Bokeh blur, Noise blur, Nebula, Bloom, FBM, Godrays, Mouse trail, Mouse ripple, Light draw
Two cheap tricks: apply an effect once to the whole scene instead of to several individual layers, and use a pre-rendered image for anything complex that doesn't move.
On Your Page
A few embed settings help beyond the scene itself:
- Lazy load below-the-fold scenes with
data-us-lazyload="true". They're removed from the critical startup path and prewarmed during browser idle time. Keep above-the-fold heroes eager. - Production mode (
data-us-production="true") serves scene data from a CDN — faster loads, better caching. - Load the SDK in your
<head>(withasyncordefer) if your scene is in the initial viewport. The same applies to custom code in Framer, Webflow, and other site builders. - Use the latest SDK version. Older versions are missing key optimizations.
- Limit scenes per page. Each scene adds load time and memory. Stay under 10 — WebGL allows a maximum of 16 contexts.
What You Get For Free
Unicorn Studio also optimizes automatically. At publish, shader code is compiled and optimized per layer, and editor-only data is stripped from your scene. At runtime, static layers are compressed into a single texture, rendering pauses when the scene leaves the viewport, and expensive work is throttled whenever possible.
Always check your scene on a few real devices and browsers before shipping.